As more and more organizations adopt DevOps in various spheres of their operation, reducing workload is a top priority these days. New tools and technologies like Generative AI do make the work easier for DevOps engineers but having the right processes and systems in place is equally important.
One such process-driven optimization comes in the form of telemetry. It is the process of recording and transmitting data from remote/inaccessible sources to a centralized system for monitoring and analysis. When considered in the context of DevOps and software development, telemetry involves automatically collecting metrics and data about how applications and systems are behaving and performing in production environments.
Evidently, the primary goal of telemetry is to provide visibility into the real-world usage and operation of software applications. It enables development teams to understand things like feature usage patterns, bugs or crashes, performance bottlenecks, user preferences, and more – all based on actual data rather than soliciting feedback directly from users.
How Telemetry Works
Here are the key components and workflow of telemetry in a DevOps context:
1. Data Collection:
Data collection is broadly classified into two categories:
- Metrics: DevOps teams leverage various tools to capture data (metrics) at different stages of the SDLC. This data can include:
- Build health data from source code.
- Logs from artifact repositories.
- CI/CD pipeline failures.
- Application performance during testing.
- Resource utilization in production environments.
- User interaction and feature usage.
- Instrumentation: During application development, lightweight code snippets are embedded (instrumented) to collect specific data points.
2. Data Transmission:
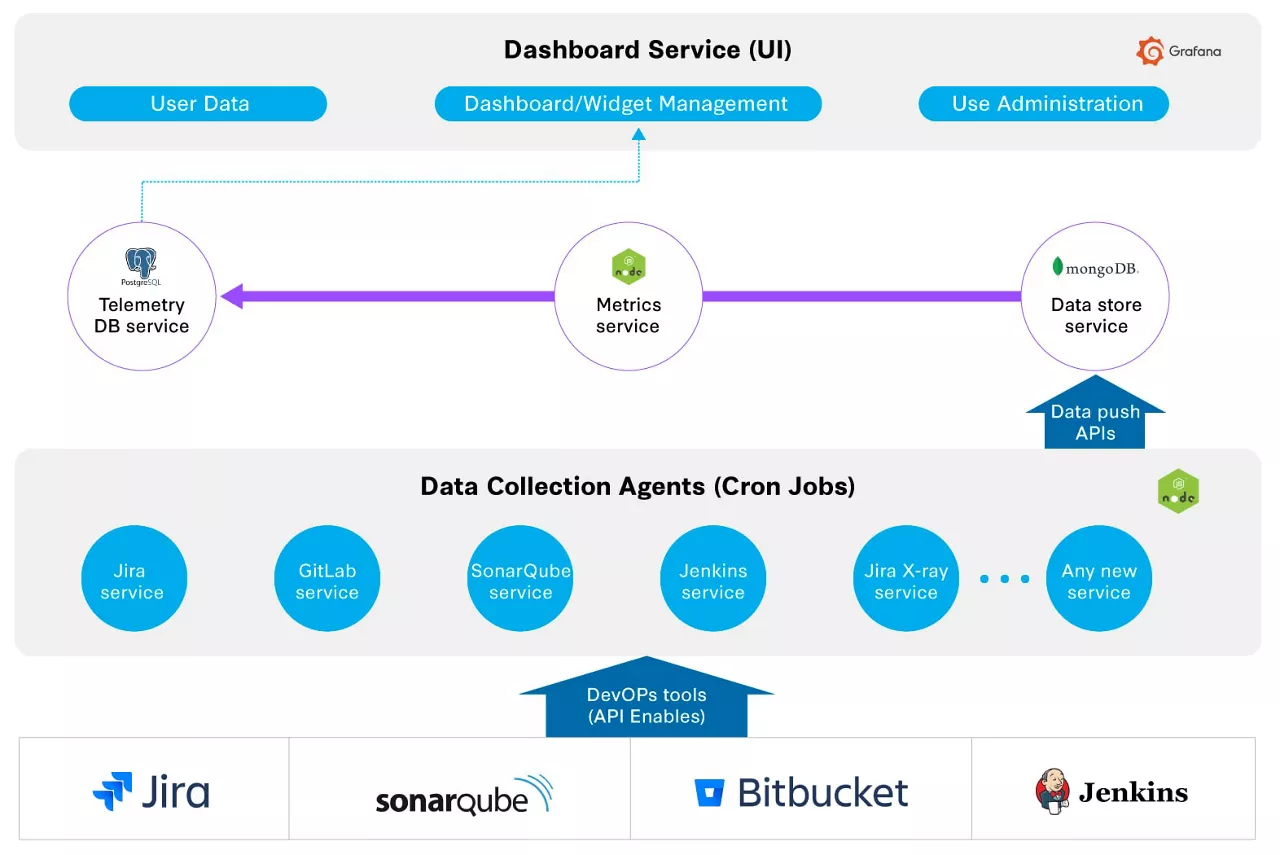
The collected data is transmitted securely to a centralized telemetry platform. This platform can be a dedicated monitoring tool or part of a DevOps toolchain.
3. Data Processing and Analysis:
The telemetry platform aggregates and processes the collected data. This data is transformed into a format suitable for analysis, often using time-series databases.

(Credits)
4. Visualization and Alerting:
The platform provides visualizations like graphs and dashboards to present the data in an easily digestible format.
Real-time alerts can be configured to notify teams of potential issues based on predefined thresholds or anomaly detection.
Key Categories Of Telemetry Data And How DevOps Teams Use It
Now that you have a basic idea of how telemetry works, let us now understand the different types of telemetry data and learn their utility from DevOps POV:
Application logs keep track of failures, warnings, transactions, and other events in great detail. These logs are used by developers and DevOps teams to find problems and keep track of what’s happening. Thus, you need to set up logging and put all your logs in one place (like the ELK stack) to make it work. This setup will ensure that your logs are saved and collected so that they can be easily accessed and analyzed.
Application metrics give you numeric signs like response times, throughput, and mistake rates. They are used by DevOps teams to judge their success. We’d also recommend setting up warning limits as it helps make the best use of resources. You will be needing tracking tools like Prometheus and a public dashboard like Grafana to monitor such metrics.
To get information on activities from start to finish across platforms, you will need to enforce distributed tracing. It helps figure out where problems and bottlenecks are in distributed systems. You can enforce tracing with the help of tracking systems like Jaeger to your services. This exercise helps you understand how services work together and how long they take.
Real User Monitoring (RUM) records how users interact with a website on the client side. This information helps teams figure out how people really use the app and find UX problems. This includes what users do, how long it takes for pages to load, and client problems. You can use RUM tools like New Relic or Google Analytics to do so.
Infrastructure Monitoring gives hosts, groups, and services information about how their resources are being used. This helps DevOps teams make the best use of resources and connect the health of an application’s technology to its speed. You may choose tools like Nagios or Datadog to set up system tracking. These tools keep track of CPU, memory, disk, and network I/O data.
Deployment Data helps you learn about updates, deployments, and build files. This lets teams make sure that releases are correct by connecting deployments to how applications were seen to behave. You may use tools like Jenkins or GitLab CI to set up CI/CD workflows. Their job is to keep track of code commits, release schedules, and test findings. You can use this information to find changes and see how they affect how well an application works.
Telemetry Data Collection Techniques:
Here are the four main types of telemetry data collection techniques:
- Instrumentation: Embedding telemetry data collection logic directly into the application code using libraries, SDKs, or APIs.
- Agent-based: Deploying monitoring agents on servers or containers to collect system-level metrics and logs.
- Tracing: Capturing end-to-end request flows and distributed transactions across microservices.
- Synthetic Monitoring: Simulating user interactions and monitoring the application from an external perspective.
| Technique | Pros | Cons |
| Instrumentation | Granular and customizable data collection | Requires code changes and deployments |
| Agent-based | Easy to deploy and collect system-level data | Limited visibility into application internals |
| Tracing | Provides end-to-end visibility of requests | Can introduce overhead and complexity |
| Synthetic Monitoring | Simulates real user interactions | Limited coverage of application scenarios |
Cultural Benefits of Implementing Telemetry in DevOps
As you might expect, there’s a cultural impact of formalizing telemetry as a part of your DevOps workflow. Here are the benefits of telemetry that you may expect:
- Proactive Problem Solving: Telemetry enables teams to anticipate issues and address them before they affect the end users.
- Data-Driven Decisions: With accurate, real-time data, decisions regarding resource allocation, scalability, and user experience improvements are more informed.
- Enhanced User Satisfaction: Quick resolution of issues and optimized performance lead to higher user satisfaction and retention.
- Operational Efficiency: Automation of data collection and alerting frees up resources and reduces the manual overhead in monitoring and maintenance.
Wrap Up
While telemetry provides you with multiple benefits that serve the purpose of DevOps, it also leaves you exposed to risks like data security and privacy hazards. You might also need to take care of GDPR, HIPAA as well as provisions to deal with PHI and PII. On top of that, you might get strained due to sheer data volume and complexity, its integration in a heterogeneous DevOps environment, interoperability, and the required skill set also come as sizeable challenges.
Having said that, telemetry will empower DevOps teams to embed data-driven decisions into their culture and drive innovation, efficiency, and customer satisfaction.
Looking for a remote DevOps job?
Signup for Talent500 now!


Add comment