In the era of data-driven decision-making, A/B testing has emerged as a cornerstone for businesses seeking to optimize strategies and refine user experiences. This experimental method allows organizations to systematically compare two versions of a product or service, providing valuable insights into performance metrics. In this blog, we will look into the intricacies of A/B testing while also exploring its fundamental principles, key elements, hypothesis formulation, experimental design, implementation, and result interpretation. Throughout this article, we look into the importance of a well-structured approach and also look at a few examples that will explain it all the better.
What is A/B Testing?

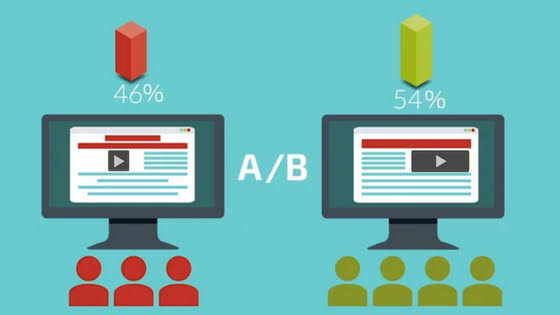
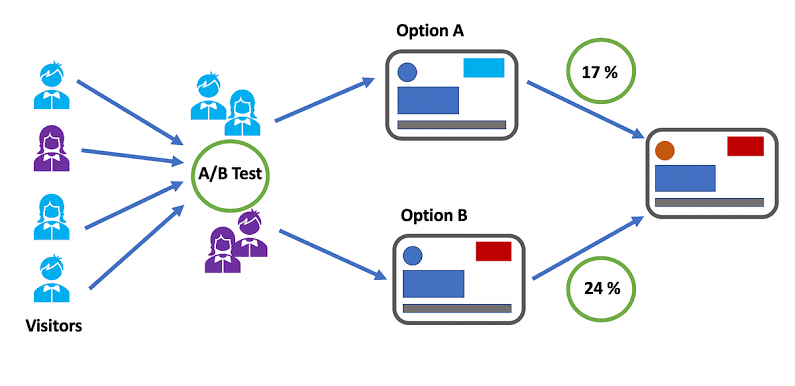
A/B testing, also known as split testing, is a statistical method that involves dividing a sample population into two groups, A and B, to compare different versions of a variable. The primary goal is to determine which version performs better based on predefined key performance indicators (KPIs). This method finds applications across various domains, including marketing, web development, and product design, enabling organizations to make informed decisions grounded in empirical evidence.
The Key Elements of A/B Testing
Identifying the Control and Treatment Groups
In A/B testing, a control group (A) experiences the current version, while a treatment group (B) encounters the modified version. Randomly assigning individuals to these groups helps ensure a representative sample, reducing selection bias.
Randomization Techniques
Randomization is crucial for minimizing confounding variables and ensuring comparability between the control and treatment groups. Let’s look at a Python code snippet for simple random assignment:
python
import numpy as np
# Assuming ‘users’ is a list of user IDs
control_group = np.random.choice(users, size=int(len(users)/2), replace=False)
treatment_group = list(set(users) – set(control_group))
Choosing Appropriate Metrics and KPIs

Selecting relevant metrics is vital for accurate evaluation. Examples include conversion rates, click-through rates, and revenue. The following code demonstrates how to calculate conversion rates:
python
# Assuming ‘clicks’ and ‘purchases’ are arrays of user interactions
conversion_rate_control = np.sum(purchases[control_group]) / len(control_group)
conversion_rate_treatment = np.sum(purchases[treatment_group]) / len(treatment_group)
Formulating a Hypothesis
A well-defined hypothesis is the cornerstone of any A/B test. It predicts the expected outcome and guides metric selection. Consider the following e-commerce example:
Hypothesis: If we change the color of the “Buy Now” button from blue to green, then we expect to see a higher click-through rate because green is associated with positive actions.
Designing the Experiment
Planning the Experiment Timeline and Duration
Careful planning of the experiment timeline is essential for capturing sufficient data and accounting for external factors. Python code can assist in visualizing the timeline:
python
import matplotlib.pyplot as plt
import pandas as pd
# Assuming ‘data’ is a DataFrame with timestamps
data[‘timestamp’] = pd.to_datetime(data[‘timestamp’])
data.set_index(‘timestamp’).resample(‘D’).size().plot()
plt.title(‘Experiment Timeline’)
plt.xlabel(‘Date’)
plt.ylabel(‘Number of Participants’)
plt.show()
Sample Size Determination
Determining the sample size ensures the experiment has enough statistical power. The following Python code uses the statsmodels library for sample size calculation:
python
import statsmodels.stats.api as sms
effect_size = 0.5 # set based on expected impact
alpha = 0.05 # significance level
power = 0.8 # desired power
sample_size = sms.NormalIndPower().solve_power(effect_size, power=power, alpha=alpha, ratio=1.0)
print(f”Required sample size: {round(sample_size)}”)
Ethical Considerations and Potential Pitfalls
Addressing ethical considerations, such as participant consent and data privacy, is integral to experimental design. Python code does not directly handle ethics, but incorporating participant information and consent mechanisms is essential.
Implementing A/B Testing

Execution of the Experiment and Data Collection
Implementation involves applying changes to the treatment group and collecting data. Python code for data collection might look like this:
python
# Assuming ‘data’ is a DataFrame with relevant metrics
control_data = data[data[‘user_id’].isin(control_group)]
treatment_data = data[data[‘user_id’].isin(treatment_group)]
Dealing with External Factors
Monitoring and controlling external factors is crucial. Python code for detecting and visualizing external influences could involve time-series analysis or anomaly detection algorithms, depending on the nature of the data.
Monitoring and Analyzing Results in Real-time
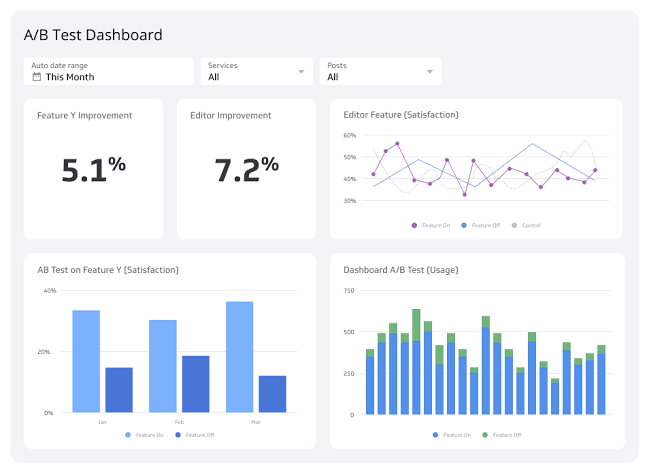
Real-time monitoring enables prompt responses to unexpected trends. Python code using libraries like Matplotlib or Seaborn can generate real-time visualizations of key metrics.
Example:
python
Copy code
import matplotlib.pyplot as plt
# Assuming ‘data’ is a DataFrame with relevant metrics
data[‘date’] = pd.to_datetime(data[‘date’])
daily_conversion_rates = data.groupby([‘date’, ‘group’])[‘conversion’].mean().unstack()
plt.figure(figsize=(10, 6))
plt.plot(daily_conversion_rates[‘control’], label=’Control’)
plt.plot(daily_conversion_rates[‘treatment’], label=’Treatment’)
plt.title(‘Daily Conversion Rates Over Time’)
plt.xlabel(‘Date’)
plt.ylabel(‘Conversion Rate’)
plt.legend()
plt.show()
Interpreting Results and Drawing Conclusions
Statistical Significance vs. Practical Significance
Balancing statistical and practical significance is crucial. Python code can facilitate the computation of both, ensuring a comprehensive interpretation of the results.
Communicating Findings to Stakeholders
Effective communication involves visualizing results. Python code using libraries like Matplotlib, Seaborn, or Plotly can create insightful visualizations for stakeholder presentations.
Iterative Testing and Continuous Improvement
Iterative testing is inherent in A/B testing. Python code for comparing and contrasting results across multiple experiments facilitates continuous improvement:
python
# Assuming ‘experiment_results’ is a DataFrame with results from multiple experiments
average_conversion_rates = experiment_results.groupby(‘experiment’)[‘conversion’].mean()
plt.figure(figsize=(8, 5))
average_conversion_rates.plot(kind=’bar’)
plt.title(‘Average Conversion Rates Across Experiments’)
plt.xlabel(‘Experiment’)
plt.ylabel(‘Average Conversion Rate’)
plt.show()
Conclusion
In conclusion, A/B testing is a versatile and powerful tool in the data scientist’s toolkit, enabling evidence-based decision-making and continuous improvement. This blog has outlined the fundamental principles of A/B testing, providing detailed code examples for key concepts. By embracing a systematic and data-driven approach, businesses can gain valuable insights, enhance user experiences, and thrive in an increasingly competitive landscape. As organizations continue to evolve, the role of A/B testing remains pivotal in shaping the future of data science and business analytics.


Add comment