

Introduction
DevOps and SRE professionals always work on maintaining constant application availability. It is our top priority to have the application working smoothly at all times. This, however, is not a simple operation. Just like Countries have agencies to monitor activities, in a similar way DevOps/SRe professional deploy tooling to montor their system at all times. I’d like to stress on the meaning of two terms: monitoring and observability.
Monitoring means collecting, analysing, and making sense of data from a variety of sources in order to figure out how a system or application is doing right now and find any problems. Metrics can be used to track how resources are used, how well something works, and how often mistakes happen. Monitoring is meant to catch problems before they get worse and give information that can be used to figure out what’s wrong and fix it.
A system is observable if its state can be figured out from how it acts. It’s an important part of monitoring because it lets engineers know how things are going without actually touching the system. Logs, traces, metrics, and the ability to play back past events can all be used to learn about how a system has changed over time.
When used in tandem, monitoring and observability give engineers a full picture of a system’s status, so they can spot problems early and fix them efficiently. In this blog, our major focus is on Observability and an opensource tool called, “Prometheus”. Let’s get right to it.
Observability
The observability of anything may be broken down into three primary parts:
- Metrics are numerical numbers that, at a given point in time, indicate the condition of a system. Metrics are used to measure performance. Utilization of the central processing unit (CPU), memory utilisation, and error rates are some examples of measurements.
- Logs are simply records that keep track of the activities that have taken place within a system. They include specific information on what occurred and when they occurred, which may be utilised to identify issues and get a better understanding of how a system operates.
- Tracing is the capacity to follow a request as it travels through a distributed system, following it from beginning to conclusion. Tracing refers to the ability to monitor a request. It offers visibility into the ways in which the various components of a system interact with one another and may be used to discover bottlenecks and performance concerns.
Engineers are able to promptly detect and rectify issues, ensure that the system is operating smoothly, and maintain the intended level of service in accordance with SLOs when an all-encompassing observability strategy is in place and in use, that is we have logging, metrics and tracing in place.
SLOs/SLIs/SLAs
SLO, SLI, and SLA are all related concepts that are used in the context of business and performance indicators. SLO stands for “Service Level Objective,” while SLI and SLA stand for “Service Level Indicator” and “Service Level Agreement,” respectively.
SLO, which stands for “Service Level Objective,” is a performance goal that can be measured and describes the level of service that is wanted for a certain business or technical goal. It says what the service should be able to do under normal circumstances.
Service Level Indicator (SLI) is a metric used to see if the service is meeting its Service Level Objective (SLO). It is a number that can be used to quantify how well a service works.
Service Level Agreement (SLA) is a contract between a service provider and a customer that outlines the level of service that will be provided, as well as the SLOs and SLIs that will be used to measure performance. It also says what will happen if the service provider doesn’t meet the levels of service that were agreed upon.
In short, SLOs define what the service should be able to do, SLIs measure whether the service is meeting its SLOs, and SLAs are agreements that define the level of service and what will happen if the service provider doesn’t meet the agreed-upon levels of service.
Prometheus
The open-source monitoring and alerting system known as Prometheus is quite popular. It contains a number of characteristics that make it well-suited for the purpose of monitoring and alerting on time-series data, which is one of the reasons why it was built for this purpose.
The design of Prometheus is centred on a data model that makes use of a time-series database to keep track of metric values. The data model is straightforward, with each metric being represented as a time-series that has both a distinctive name and a group of dimensions that have been tagged. Metrics are gathered by Prometheus utilising a pull-based methodology, which means that the Prometheus server will regularly query a target for that target’s metrics. The Prometheus Query Language, often known as PromQL, is an extremely sophisticated query language that gives users the ability to select and aggregate time-series data in real time.
Prometheus Architecture
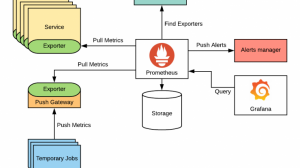

Prometheus has a modular design that is made up of the following parts:
- Prometheus Server: This is the most important part of Prometheus. It scrapes metrics from targets, stores them in a time-series database, and handles queries.
- Exporters are programmes that take measurements from other systems and put them into the Prometheus data model. For popular systems like MongoDB, HAProxy, and JMX, there are a lot of third-party exporters you can use.
- Alertmanager: This part is in charge of sending alerts based on the rules that were set up in Prometheus. It lets you group, route, and get rid of duplicate alerts, and it can send notifications to email, Slack, webhooks, etc.
- Grafana is a third-party tool for visualising data that can be used to make dashboards and see how Prometheus metrics look.
- PushGateway is prometheus is an alternative to pull based failure. In Kuberntes, there are jobs are killed after there task is completed. Push Gateway is used to scrape this metrics before the jobs die. Prometheus can then pull these metrics from the push gateway.
Prometheus is known for being scalable because it can handle a lot of metrics and a lot of queries at the same time. Multiple Prometheus servers can work together to handle a high rate of queries. This is called horizontal scalability.
The architecture of Prometheus is made so that it is reliable and can handle mistakes. It can scrape metrics from multiple sources, store data in a time-series database, and answer queries in real time. It’s used by developers and operations teams to keep an eye on their systems and apps, and it’s become a popular tool in the cloud-native ecosystem.
Prometheus Installation
OS Based
Prometheus can be installed on a variety of platforms and environments, including Linux, macOS, and Windows. The installation process typically involves the following steps:
- Download the Prometheus binary: The first step is to download the Prometheus binary from the Prometheus website (https://prometheus.io/download/). You can choose the version that is appropriate for your operating system and architecture.
- Extract the binary: Once the binary is downloaded, you can extract it to a directory of your choice, ideally /bin.
- Configure Prometheus: Prometheus uses a configuration file to control various settings, such as the scrape interval, the targets to scrape, and the alerting rules. The default configuration file is located in the Prometheus directory and is named prometheus.yml
- Start Prometheus: Once the configuration is done, you can start Prometheus by running the binary with the appropriate flags. The default flags include the location of the configuration file, and the directory where Prometheus will store the data.
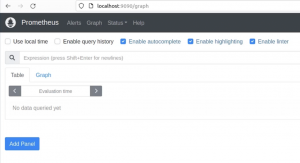
- Verify the installation: To verify that Prometheus is running correctly, you can check the logs for any errors, and also check the Prometheus web interface, which is available at http://localhost:9090 by default.

- Add Exporters: Prometheus uses exporters to pull metrics from external systems. To add Exporters, you can download the appropriate exporter binary from the Prometheus website and configure it to scrape metrics from the target system.
- Keep in mind that depending on your system and the way you want to use it, you may need to take some additional steps to secure and harden your Prometheus installation.
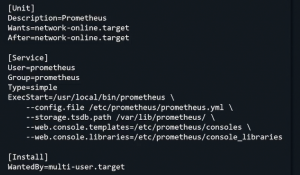

- You may also need to run prometheus as systemd process, meaning the prometheus starts running on boot.
It’s also worth mentioning that you can install Prometheus via package manager like apt, yum or brew depending on your OS. You can also use containerization tools such as Docker and Kubernetes to deploy Prometheus in a containerized environment.
Installation on Kubernetes
Prometheus clusters on Kubernetes may be deployed and managed with the help of the Prometheus Operator. A Prometheus instance, an Alertmanager instance, and a ServiceMonitor resource may all be created, configured, and managed via this tool.
Here are the general steps to install Prometheus on Kubernetes using the Prometheus Operator:
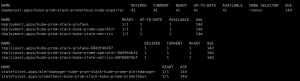
- Install the Prometheus Operator: You can install the Prometheus Operator using a Helm chart, by using the Kubernetes manifests directly, or by using the Operator Lifecycle Manager (OLM).
- Create a Prometheus CRD: The Prometheus Operator uses Kubernetes Custom Resource Definitions (CRDs) to define and manage Prometheus instances. You can create a Prometheus CRD by creating a YAML file that defines the Prometheus instance, including the scrape targets, retention time, and other settings.
- Create a ServiceMonitor: The ServiceMonitor resource allows you to specify the targets that Prometheus should scrape. You can create a ServiceMonitor by creating a YAML file that defines the scrape targets and other settings.
- Create an Alertmanager: You can create an Alertmanager instance by creating a YAML file that defines the Alertmanager settings.
- Deploy the Prometheus Operator: Once the configuration is done, you can deploy the Prometheus Operator by running the appropriate command on your Kubernetes cluster.
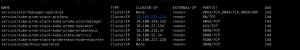
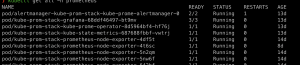
- Verify the installation: To verify that Prometheus is running correctly, you can check the logs for any errors, and also check the Prometheus web interface, which is available at a URL like http://prometheus-k8s-<namespace>.<cluster-domain> by default.


You may quickly grow the number of Prometheus instances, update to newer versions of Prometheus, and make changes to the configuration of Prometheus without causing any disruptions if you use Prometheus Operator.
Prometheus Operator is a powerful tool, but it also has some limitations, and it’s not the only way to deploy Prometheus on Kubernetes; you can also use other methods, such as deploying it as a standalone pod or making use of Statefulset. It’s important to note that while the Prometheus Operator is a powerful tool, it also has some limitations.
Benefits of Using Prometheus
Scalability: Prometheus is made to handle a lot of metrics and a lot of queries at the same time. Multiple Prometheus servers can work together to handle a high query rate, making it horizontally scalable.
Flexibility: Prometheus has a simple and flexible data model, so it can be used to monitor a wide range of systems and applications. It also has a powerful query language called PromQL that lets users select and combine time-series data in real time.
Alerting: Prometheus has a powerful alerting system that lets you set rules for when alerts should be triggered based on the metrics that Prometheus collects. The alerts are sent to the Alertmanager, which is in charge of sending notifications to different endpoints.
Multi-dimensional data model: With Prometheus, you can label metrics, which lets you search for and filter data by different dimensions.
Exporters: Prometheus has a wide range of exporters for different systems, making it easy to connect to existing systems and get metrics from different sources.
Open-source: Because Prometheus is open-source software, you can use it for free and easily change it to meet your needs.
Kubernetes integration: The Prometheus Operator is a native Kubernetes solution that makes it easier to set up and manage Prometheus instances on a cluster.
Community support: Prometheus has a large and active community that offers help, documentation, and a wide range of exporters, clients, and other tools.
Grafana integration: Grafana is a popular visualisation tool that can be easily integrated with Prometheus. This lets users create dashboards and see metrics stored in Prometheus.
High availability: To get high availability, Prometheus lets you run multiple instances at the same time.
Conclusion
Prometheus is easy to install and integrate with various systems and platforms, including Kubernetes, and it has a wide variety of exporters available for popular systems. It also has a large and active community that provides support, documentation, and a wide variety of exporters, clients, and other tools. Prometheus is a widely adopted tool in the cloud-native ecosystem and it’s a great option for monitoring and alerting on modern systems.
In subsequent blogs, we will dive deeper into learning Prometheus Query Language and configuring alerting for Prometheus. Stay Tuned.
