

Software applications need to perform optimally to meet user expectations and business requirements. Poor application performance can lead to dissatisfied users, lost revenue, and damage to a company’s reputation. To ensure applications can handle real-world user loads, performance testing is crucial. In this blog, we will explore how to create performance-testing scripts using two popular tools, JMeter and Gatling. We’ll delve into their setup, scripting methods, and how to analyze the gathered data to make informed decisions about application performance improvements.
Why Performance Testing Matters
Performance testing is a crucial aspect of the software development lifecycle. It helps identify bottlenecks and performance issues before an application is deployed to a production environment. The primary objectives of performance testing are:
- Assessing Responsiveness: To evaluate how quickly the system responds to user interactions under various load conditions.
- Scalability: To determine how well the application scales with an increasing number of users.
- Stability: To check if the system can handle prolonged usage without failure or performance degradation.
- Resource Utilization: To monitor and optimize resource consumption, such as CPU, memory, and network bandwidth.
Performance Testing Tools – JMeter and Gatling
JMeter and Gatling are two popular open-source tools for performance testing, each with its unique strengths.
Apache JMeter

java
import org.apache.jmeter.protocol.http.sampler.HTTPSampler;
import org.apache.jmeter.testelement.TestPlan;
import org.apache.jmeter.threads.ThreadGroup;
import org.apache.jmeter.control.LoopController;
import org.apache.jmeter.engine.StandardJMeterEngine;
import org.apache.jmeter.reporters.ResultCollector;
import org.apache.jmeter.reporters.Summariser;
import org.apache.jmeter.save.SaveService;
import org.apache.jmeter.util.JMeterUtils;
public class JMeterPerformanceTest {
public static void main(String[] args) throws Exception {
// Initialize JMeter
JMeterUtils.loadJMeterProperties(“jmeter.properties”);
JMeterUtils.setJMeterHome(“path_to_jmeter_home”);
JMeterUtils.initLocale();
// Create Test Plan
TestPlan testPlan = new TestPlan(“Performance Test Plan”);
// Create Thread Group
ThreadGroup thread group = new ThreadGroup();
threadGroup.setNumThreads(100);
threadGroup.setRampUp(10);
threadGroup.setSamplerController(new LoopController());
// Create HTTP Sampler
HTTPSampler httpSampler = new HTTPSampler();
httpSampler.setDomain(“example.com”);
httpSampler.setPort(80);
httpSampler.setPath(“/api/endpoint”);
httpSampler.setMethod(“GET”);
// Add Sampler to Thread Group
threadGroup.addTestElement(httpSampler);
threadGroup.addTestElement(new ResultCollector(new Summariser()));
// Assemble Test Plan
testPlan.addThreadGroup(threadGroup);
testPlan.addTestElement(httpSampler);
// Save Test Plan to file
SaveService.saveTree(testPlan, SaveService.getFileOutputStream(“test_plan.jmx”));
// Run Test Plan
StandardJMeterEngine jMeterEngine = new StandardJMeterEngine();
jMeterEngine.configure(SaveService.loadProperties(“jmeter.properties”));
jMeterEngine.run();
}
}
Gatling

scala
import io.gatling.core.Predef._
import io.gatling.http.Predef._
import scala.concurrent.duration._
class GatlingPerformanceTest extends Simulation {
val httpProtocol = http
.baseUrl(“http://example.com”)
.acceptHeader(“application/json”)
val scn = scenario(“Performance Test Scenario”)
.exec(http(“request_1”)
.get(“/api/endpoint”)
)
setUp(
scn.inject(
rampUsers(100) during (10 seconds)
)
).protocols(httpProtocol)
}
Setting Up the Tools
Both JMeter and Gatling require Java to be installed on the system. Ensure that you have the latest version of Java Development Kit (JDK) installed before proceeding.

Setting up JMeter
- Download the latest JMeter binary from the Apache JMeter website (https://jmeter.apache.org/download_jmeter.cgi).
- Unzip the downloaded file to your preferred location.
- Navigate to the JMeter bin directory and run the JMeter executable (jmeter.bat for Windows or jmeter.sh for Linux).
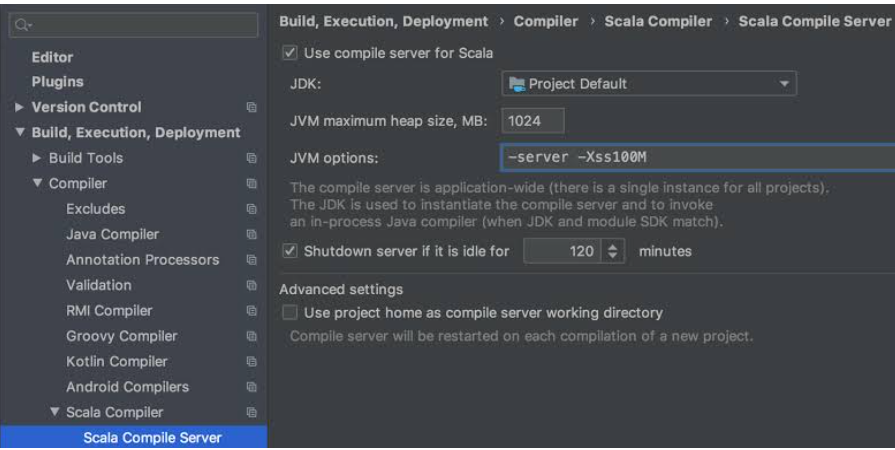
Setting up Gatling
- Download the latest Gatling bundle from the Gatling website (https://gatling.io/open-source/start-testing).
- Unzip the downloaded file to your preferred location.
- Gatling does not require any installation, and it’s ready to use once extracted.

Creating Performance Testing Scripts
Now that we have the tools set up, let’s dive into creating performance-testing scripts using both JMeter and Gatling.
Performance Testing with JMeter:
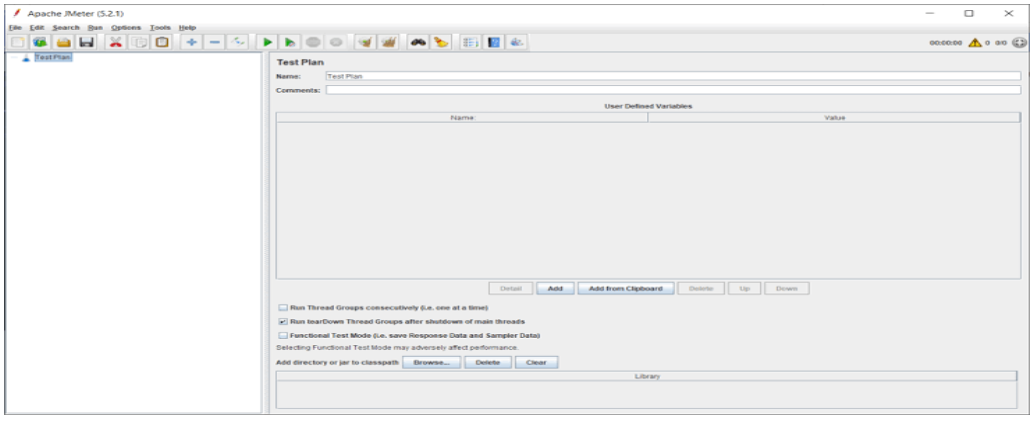
Step 1: Creating a Test Plan
- Launch JMeter and right-click on “Test Plan.”
- Select “Add > Threads (Users) > Thread Group” to create a Thread Group.
- Set the number of threads (users) and ramp-up time to simulate gradual user load.
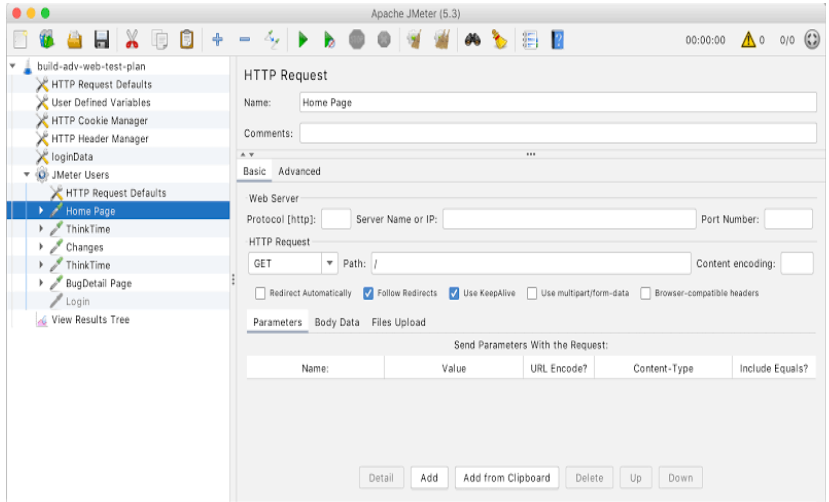
- Right-click on the Thread Group and add a sampler, for example, “HTTP Request” to simulate web requests.
Step 2: Configuring Samplers
- Configure the sampler by providing the server’s hostname, port, and other relevant details.
- Add additional configurations such as headers, authorization, etc., if necessary.
Step 3: Adding Listeners
Listeners display the test results in various formats like graphs, tables, and trees.
Right-click on the Thread Group and add a listener (e.g., “Summary Report” or “View Results Tree”) to view the results.
Step 4: Running the Test
- Save the Test Plan and click the green play button to start the test execution.
- JMeter will simulate the specified user load, and the listeners will display the results in real time.
Performance Testing with Gatling
Step 1: Creating a Gatling Scenario
- In the Gatling folder structure, navigate to “user-files > simulations.”
- Create a new Scala script (e.g., “MySimulation.scala”) to define the test scenario.
Step 2: Writing the Gatling Script
- Use Gatling’s DSL to define the scenario, including the HTTP request, pause times, and assertions.
- Gatling’s DSL offers an intuitive and expressive way to script performance tests.
Step 3: Executing the Gatling Test
- Open a terminal and navigate to the Gatling folder.
Execute the Gatling command, specifying the simulation class to run the test (e.g., “./bin/gatling.sh -s MySimulation”).
Analyzing Performance Test Results
Both JMeter and Gatling provide valuable performance test results to analyze and draw insights from. The gathered data can help identify performance bottlenecks and areas that require optimization.
JMeter
- JMeter generates comprehensive reports that include response times, throughput, error rates, and more.
- Use JMeter’s listeners and graph features to visualize the test results.
- Export the data to various formats like CSV or XML for further analysis using external tools.
Gatling
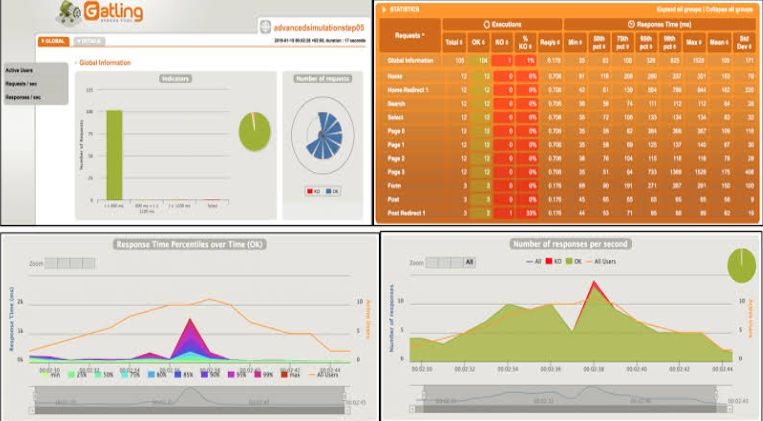
- Gatling generates detailed HTML reports with interactive graphs and statistics.
- The real-time console displays key metrics during test execution, helping to identify performance issues immediately.
- Gatling reports are highly customizable and can be easily integrated into continuous integration systems.
Interpreting Performance Test Results
Understanding the performance test results is vital to make informed decisions and take appropriate actions for system improvement. Here are some essential metrics to consider:
- Response Time: The time taken by the system to respond to user requests. Longer response times indicate potential performance issues.
- Throughput: The number of requests processed per unit of time. High throughput indicates good performance, while low throughput may signal bottlenecks.
- Error Rate: The percentage of failed requests. A high error rate may indicate unstable system behaviour.
- Resource Utilization: Monitor CPU, memory, and network usage during the test. High resource consumption may affect performance.
- Bottlenecks: Identify specific components or endpoints that are causing performance degradation.
Conclusion
Performance testing is a critical process to ensure applications can handle real-world user loads effectively. Tools like JMeter and Gatling empower developers and testers to create reliable performance testing scripts and gain insights into system behaviour under various conditions. By following best practices and analyzing the test results, teams can identify bottlenecks and optimize their applications for peak performance. Implementing performance testing as an integral part of the development process will lead to more stable, scalable, and high-performing applications, satisfying user expectations and driving business success.
